Friday, June 6, 2014

Why most people think that -0.9 Kg/cm2 gauge is the correct value of Condenser Vacuum?

Most Steam Turbines in India are designed considering Cooling Water Inlet Temperature of 33 degC and temperature rise of 9 degC through the Condenser.

Assuming Terminal Temperature Difference (TTD) of 4 degC the saturation temperature at Turbine exhaust works out as follows
CW Inlet Temperature + Temperature rise through Condenser + TTD
=33+9+4 = 46 degC

Turbine Back Pressure corresponding to 46 degC is 0.101 Bar and 0.103 Kg/cm2

Most Thermal Power Stations are located at Mean Sea Level (MSL) between 200 to 250 Metres and the Barometric Pressure corresponding to these elevations are 1.003 Kg/cm2 and 1.009 Kg/cm2.

If you subtract 1.003 from 0.103 you get -0.9 Kg/cm2.

That is why most people think that -0.9 Kg/cm2 gauge is the correct value of Condenser Vacuum.

There is one more problem. The above are the design parameters for NTPC's flagship Thermal Power Station at Singrauli even when it has once through Cooling Water System where the Cooling Water Temperature hardly touches 27 degC. Therefore the actual Condenser Vacuum used to be much better than -0.9 Kg/cm2 not because of any achievement by the flagship station but because of once through Cooling Water System.

People not only think that -0.9 Kg/cm2 is the correct Condenser Vacuum they also think that they need to add 1 Kg/cm2 to get the absolute value of Back Pressure i.e. -0.9 + 1 = 0.1 ata  assuming Barometric Pressure as 1 Kg/cm2.

Today I am dealing with one person at 2x500 MW Durgapur Steel Thermal Power Station at DVC who is getting 0.1077 ata by adding 1 Kg/cm2 and thinks that it is correct and apparently there is no vaccum problem although the LP Turbine exhaust and Hotwell Temperatures are indicating 50 to 51 degC.

The Mean Sea Level at the Power Station is 73 Metres and the Barometric Pressure corresponding to it is 1.024 Kg/cm2.

Therefore the correct Turbine Back Pressure would be
= 0.1077-1.0+1.024 = 0.1317 ata which is very poor vacuum.

When I am delivering lectures on Turbine Efficiency my first lesson is to show the variation of Barometric Pressure with altitude of the place.

There is another interesting incidence of JSW Energy at Vijaynagar (Torangallu).

The Mean Sea Level at Torangallu is 520 M and the Barometric Pressure corresponding to it is 95.22 Kpa. The design back pressure is 10.05 Kpa but the station people are using 100 Kpa as Barometric Pressure and saying that design value of Condenser Vacuum is 10.05-100 = -89.95 Kpa.

In fact they were not believing what I was teaching till I pointed out to them that the Barometric Pressure recorded in the PG Test Report was 95.193 Kpa so close to the value I told.

One should say that the design value of Turbine Back Pressure is 10.05 Kpa and if you convert it to Condenser Vacuum it will be -85.17 Kpa valid only for Torangallu and not for Ratnagiri the other Power Station of JSW Energy where the Barometric Pressure is 100.7 Kpa and the Condenser Vacuum should be -90.65 Kpa (Notice the difference of 5.48 Kpa).

Update on 14th July 2014
Although the Condenser Vacuum should be generally -83 to -87 kPa at Torangallu it was actually in the range of -87 to -91 kPa.

Today I checked in the DCS Engineering Room and found that DCS was adding -4 kPa to what was coming from the transmitter as follows:

The transmitter has the range 0 to -100 kPa for 0 to 4 ma but the DCS was converting 0 to 4 ma into -4 to -104 kPa thereby adding  -4 kPa.

When I asked whether Chinese advised to add -4 kPa the Engineer replied that BHEL had set it like this in 130 MW Unit and same was adopted in 300 MW Units for uniformity.

So that is one example of how BHEL cheats. Off course I can write many articles about how BHEL cheats in various ways.

Instead of teaching that the Vacuum indication will be different considering the Barometric Pressure of Torangallu they have simply made the DCS to add -0.04 Kg/cm2 (BHEL still uses MKS units) to the value coming from the transmitter.



Thursday, May 22, 2014

Primary Flow Measurement for modelling of Thermal Power Stations using EBSILON Professional Software.

I am involved in implementation of Phase II - Output 2 of Indo German Energy Program (IGEN) where we have to introduce Model Power Plant Concept in identified Thermal Power Generating Units. In this phase of the program we have to demonstrate the improvements in Energy Efficiency in these Units.

During IGEN Phase II - Output 1 the licenses for EBSILON Professional Software were provided to the State Utilities and Training was also provided to use the software for identification of areas and components having major Heat Rate deviations.

The Steam Flow entering the Steam Turbine is most important input for modelling the plant using the software and since there was direct measurement available the same was used during the initial phase.

Since I was associated with Performance Guarantee Tests of similar Units in India I knew that the direct measurement of Main Steam Flow was not accurate and this flow used to be much higher than the computed Main Steam Flow during the tests. The other option was to use Feed Water Flow but I also knew that this flow also used to be always higher than the computed Feed Water Flow during the tests.

During Performance Guarantee Tests we were using special Flow Nozzle confirming to ASME PTC-6 installed to measure the Condensate Flow entering the Deaerator. The Feed Water Flow was then computed by calculating the extraction flows to High Pressure Heaters and Deaerator and adding them to Condensate Flow also considering the change in Deaerator level. This Nozzle was removed after Performance Gurantee Tests and used in other Units of the Station.

In May 2014, I went to Mettur Thermal Power Station to assist the Station for modelling of Unit no 1 which was selected for IGEN Phase II -Output 2.

Fortunately, the Condensate Flow to Deaerator measurement was available in this Unit. When we considered the data for modelling we were not getting sufficient output from the Turbine since the measured Condensate Flow was 5% lower than the expected flow. After checking we found that the Station had done modification in the Spray line to PRDS and Condensate Flow at CEP discharge was being used as spray. We considered this in the model but the spray flow was coming only 2.4 T/hr (0.5% of Condensate Flow).

Reluctantly I agreed to use Feed Water Flow for the Modelling but with a rider that we shall reduce the measured Feed Water Flow by 1.5% (based on my experience of Performance Guarantee Tests of similar units) for accurate modelling.

PCRA team was doing Energy Audit in the Station at the same time and we asked them to measure the spray flow to PRDS by using portable Ultrasonic Device and it was found as 2 T/hr i.e. nearly same as predicted by the model.

I was not happy with the measured Condensate Flow and insisted on measurement of Differential Pressure. When the Differential Pressure was measured the calculated flow from its reading was 5% higher than indicated reading in the DCS. The C&I Maintenance Engineer corrected it.

Thus we could do accurate modelling of the Unit by using Condensate Flow to Deaerator at Unit 1 of Mettur Thermal Power Station. The computed Feed Water Flow was lower by 1.5% compared to measured Feed Water Flow confirming my previous experience.


Friday, August 30, 2013

Comments on Press Reports comparing Chinese Power equipment with BHEL supplied equipment.

I have started my career as Engineer Trainee in BHEL Haridwar in 1973. I was Erection Engineer and erected 4 out of 5 Turbines of 200 MW at Obra from 1977 to 1982.

Later on I joined NTPC Corporate Office and was involved in Performance Guarantee Tests of Steam Turbines of 200 MW of Singrauli, Korba and Ramagundam. We use to discuss the gap between the Design Heat Rate and actual Station Heat Rate extensively. Being pioneer in India in acceptance testing of Steam Turbines I claim a proficiency and expertise in this area which very few people could match.

I was transferred to Vindhyachal STPS in 1987 and worked in O&M of 6x210 MW Units. In these units I discovered the importance of CW Chlorination in maintaining good Condenser Vacuum which is primarily responsible for Turbine Heat Rate.

I left NTPC in 1996 and worked in DLF Industries, ALSTOM and NASL.

I joined Steag after the company was entrusted with O&M of 4x600 MW IPP at Jharsuguda. I was entrusted with Turbine Maintenance but was also associated with Performance Guarantee Tests of Steam Turbines due to past experience.

My experience at Jharsuguda tells me that Dongfang Steam Turbines are no way inferior to BHEL Steam Turbines and I am shocked to read the following news reports:

I am quoting below from these reports and responding:
The Financial Express: The CEA report found that the operating heat rate of Chinese power equipment works out to 2,719 kcal/kWh compared to 2,520 kcal/kWh for Bhel gear.
The load factor of Chinese equipment averaged 57.2% during the study while it stood at 71.6% for Bhel gear.
Bhel equipment also outdid Chinese hardware on secondary fuel oil consumption. The fuel oil consumption of Chinese equipment was 6.13 ml/kWh while it was just 3.06 ml/kWh for Bhel gear.

The Operating Heat Rate mainly depends upon the Loading Factor. When the Loading Factors are different the comparison is unfair. The Loading Factor does not depend upon the machines but what Load Schedule you get from the grid. The Power Grids are under the control of Government Bodies and give less schedule to Private Companies who are operating the Chinese supplied power plants. Once again the Fuel Oil consumption parameter is based on units generated (kWh) which will be less and the specific fuel oil consumption is more.

As an expert in the field I can say that the report has been prepared just to blackmail the Chinese suppliers and please the Politicians who might be seeking such report.

I am waiting for the Report to be made public and examine it thoroughly.


Monday, August 12, 2013

Important Feed back for KN series Steam Turbines of BHEL.

As per Report of BHEL the KN series Steam Turbines were introduced in 1997. As per the Report there were lot of problems initially and combined HP IP modules called K Turbine were sent back to works and LP Turbine called N turbine were also rectified at site. Thus the KN series.

Recently the combined HP IP module had to be reopened after overhauling due to suspected leakage from Balancing Leak off pipe.

By the way there is a Balance Drum on HP Rotor rear side and a steam pipe called balancing leak of is connected between IP 6th stage and the Balance Drum. There is a sliding joint in the pipe to take care of expansion of inner casing.

The space between inner and outer casing of K Turbine is filled with IP Turbine exhaust steam which is at 302 degC.

Due to leakage in the sliding joint of balancing leak off pipe high temperature steam at 465 degC (full load parameter) was heating the space between inner and outer casing during the cold start causing high HP Top, Bottom and Flange Temperatures, high expansion of HP Outer casing and Rotor expansions. The Top Bottom temperature differential was also high (37 degC).

This is an important feed back for these machines. In case the extraction steam temperature to Deaerator (which should be equal or 1 degC lower than IP Turbine exhaust temperature) is higher than IP Turbine exhaust it indicates leakage in these joints and should be attended by opening the K Turbine.

There are two pipes in lower half of the inner casing and the same has to be removed to attend the leakage.


Wednesday, June 12, 2013

Effect of Atmospheric Pressure on measurement of Condenser Vacuum.

I have following measurements of Condenser Vacuum for 210 MW units in two locations:

Tuticorin TPS -662 mmHg CW Inlet 33.15 degC outlet 43.3 degC
Nasik TPS -658 mmHg CW Inlet 28.3 degC outlet 36.15 degC

It appears that there is not much difference between -662 and -658 mmHg in the two measurements the difference is actually much bigger considering that Tuticorin is located at sea level and Nasik at a height of 599 metres from MSL. The barometric pressures at these locations are as follows:

Tuticorin 760 mmHg
Nasik 712 mmHg

The absolute pressure for the measurement would be:
Tuticorin -662+760 = 98 mmHg = 130 mbar
Nasik -658+712 = 54 mmHg = 72 mbar

The mercury gauges are not found in the modern plant so let me convert the values to Kg/cm2 and Kpa for understanding by the new generation of engineers:

Tuticorin -662 mmHg = -0.8998 Kg/cm2 = -88.23 Kpa
Nasik -658 mmHg = -0.89436 Kg/cm2 = -87.7 Kpa

It appears that the difference is only 0.5 Kpa but the real difference when converted to absolute pressure would be 130 - 72 = 58 mbar = 5.8 Kpa

The best way to get the atmospheric pressure of your place is to use a Barometer. In case you don't have it you can know the atmospheric pressure approximately from the altitude of the place.
-->
Altitude metres Atmospheric Pressure mbar
50 1007.27
100 1001.29
150 995.38
200 989.48
250 983.57
300 977.67
350 971.86
400 966.08
450 960.3
500 954.54
Source of the above data.

Please note that altitude of a place town/city also varies a lot e.g. if you read Wikipedia page about Nasik it gives the altitude as 560 m and it is true that the area around Godavari River is at 560 m but the Thermal Power Station is situated at 599 m. To get the correct altitude you should use the data of your power station or you can use Google Maps on this link.


Tuesday, May 14, 2013

Pump assisted Siphon in CW System of Turbine.

To understand the content of this post please read Wikipedia Page on Siphon.

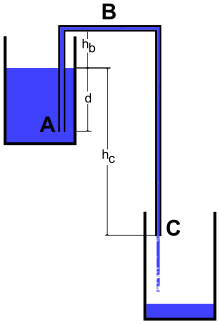
Once through CW systems are relatively unknown in Thermal Power Plants being constructed today but there are many old ones. Let us look at following image on Wikipedia page.

From Wikipedia
B can be the top point of Condenser Water Box and C the end of the outlet pipe.

The Siphon works on the basis of height difference hc. In CW System hc may be zero but the CW Pump Head equal to hc will simulate it.

In case of Siphon both inlet and outlet pipes are under vacuum. In CW System the outlet pipe will be under vacuum but inlet pipe may be under positive pressure or slight vacuum at Condenser inlet.

Since the Cooling Water picks up heat in the Water Box the pressure in Water Box should be higher than Vapour Pressure of Water at Outlet Temperature with some margin.

During Start up Vacuum is created by Condenser Water Box Priming Ejector or Vacuum Pump.

The Priming Ejector/Vacuum Pump needs to be run periodically to remove liberated dissolved gases from Cooling Water from Condenser Water Box.

Recently I visited one Thermal Power Station where I had to tell them the importance of running Water Box Priming Ejector periodically.

Wednesday, February 27, 2013

Beware! Steam Turbine Deposits of 1929 to 1936 have surfaced once again.

At one IPP in India H. P. Heater Safety Valve blew when the machine suddenly touched 103.6% of rated load. Maintenance Engineer thought that the original Safety Valve setting could have been disturbed but on checking the data in DCS it was found that the extraction pressure had actually reached the set value of Safety Valve to blow.

Now this is not a simple matter. The set pressures of Heater Safety Valves are such that the Turbine could never provide steam at that pressure i.e. the set pressure is higher than the extraction pressure under Turbine VWO (Valve Wide Open) condition. The blowing of the Safety Valve indicates restriction in the Turbine Casings.

On further analysis the Turbine First Stage Pressure was also found very high and higher than the value recorded during VWO test on Turbine. In spite of more than 6% capacity over TMCR under VWO condition established during Performance Guarantee Test the load had to be restricted at 98% of TMCR due to high First Stage Pressure. Analysis of all extraction pressures revealed restriction limited to High Pressure Turbine.

Restrictions may be caused by the deposits on Turbine Blading but Power Station Boiler Water Chemistry is very advanced since 1960's and deposits in high pressure zones are unknown.

I had to dig out a paper published in May 1936 by University of Illinois
Engineering Experiment Station. It was possible to get this paper because University of Illinois had undertaken Large-scale Digitization Project in 2007 at at Urbana-Champaign Library.


The title of the paper is The Cause and Prevention of Steam Turbine Blade Deposits and download link is here.


Prior to 1936 the Power Station Water Chemistry was evolving in USA. In fact the author of the paper was Special Research Assistant Professor of Chemical Engineering at University of Illinois.


I am taking liberty to quote from this paper:
"Purpose of Investigation.-Steam electrical generating stations
have encountered difficulty in the form of fouling of turbine blades.
This difficulty has become of major importance in many large stations,
whereas it has only meant annoyance in other stations.
There are several types of deposits which form on the turbine
blading and cause this fouling. One type is that which is apparently
caused by a deposition of solids carried in the steam from the boiler
water, and another is that caused by a chemical reaction between
chemicals in the steam and the material in the turbine blades. The
first type is the most common, and is readily distinguished from the
other in that it is largely soluble in water, and is washed off with comparative ease, whereas the other type of deposit adheres to the blades very tenaciously.
The deposition of solids carried in the steam appears to be the
major cause of difficulty. The efforts of this research have been directed entirely toward a study of this type of deposit, and no study
has been made of the other type.
The purpose of the present investigation has been to assemble
data relative to the occurrence of this type of deposit on steam turbine
blades in order to determine the cause of the difficulty and to devise
methods of preventing it."
Resume of Central Station Experience.-The following extract
from a letter serves to illustrate very clearly the difficulty caused by
this kind of turbine blade fouling.
"The operating records show the machines can only be kept in service for a matter of 3 to 4 weeks before the effective output of the machine drops about 20 per cent. The deposit is easily removed by washing, but of course this necessitates shutting down and leaving machine cool off, with a subsequent loss in the overall station efficiency as well as temporary reduction in the plant availability. The washing process adopted does not involve anything more than allowing the machine to cool down for 36 hours, and then starting up in the normal way, the condensation produced being sufficient to clear the fouling."
Although Power Station Water Chemistry is very advanced in India there is a reason to believe that Boiler Feed Water got contaminated with Cooling Water at this IPP and the conditions similar to pre 1936 in USA got created inadvertently.

Moreover when the unit was down for Annual Overhauling for more than 30 days the restriction due to high First Stage Pressure had vanished after Overhauling and there is no need to get surprised if you read the bold sentences in the above quotation from the research paper.

This post is to caution the new IPPs coming up in our country.


Wednesday, February 13, 2013

L. P. Turbine Bearings in separate pedestals.

The title may surprise new generation of Turbine Engineers because L. P. Turbine Bearings are mounted in separate pedestals since BHEL the indigenous supplier began manufacturing as per KWU (German) technology.

But if you look at 200/210 MW Steam Turbines manufactured by BHEL as per LMW (Russian) technology the bearing housing is just an extension of lower half of L. P. Turbine. Even the Generator front bearing is placed in L. P. Turbine casing.

Condensers are placed on springs which get compressed due to weight of water in hot well, Condenser Tubes and Water Boxes. This may bring the bearings down and there was a theory that it may affect the alignment between I. P./ L. P. Rotor and L. P./Generator Rotor. Although we did not check the rotor alignment by filling water in hot well (normal level plus additional water equivalent to water in tubes and water boxes) this was done at other power projects. When one such expert visited Obra where I was doing the erection of 200 MW Steam Turbines, I showed him that the alignment was getting affected even due to variation in ambient temperature by taking the alignment readings at 4 PM and 6 AM. This was happening because the L. P. Turbine Casing expands and contracts vertically from its foundation and the height of the bearing from foundation is considerable.

The pedestal mounted bearings have more rigidity and they are not affected by movement of L. P. Turbine Casings due to weight of water or thermal expansion.

Recently I was asked whether 4x600 MW Steam Turbines at Jharsuguda manufactured by Dongfang have bearings in separate pedestals or in the extended portion of L. P. Turbine. The answer is very simple the Steam Turbine at Jharsuguda is state of the art and the bearings are mounted in separate pedestals like BHEL KWU design. 

Sunday, January 13, 2013

Required Dew point of air for Gas tightness test of Generator and of Hydrogen when unit is running.

While I was leaving Jharsuguda for Delhi TMD Engineer informed me that the Dew Point of Instrument Air in TG Hall below Generator was -7.0 degC and asked whether he can fill air to conduct Gas Tightness Test. I told him no and informed him that the Dew Point would increase to positive value at 4.0 Bar pressure required for the Gas Tightness Test. I recommended him to check how much the Dew Point will increase from Dew Point Calculator on this site. I also checked it at 4 barg air pressure and the value is 14.9 degC. Is it ok to fill this air? NO. This is winter season and the temperature of air will go below 14.9 degC resulting into moisture in Generator.

The engineer got confused because I had allowed -7.0 degC Dew Point of Hydrogen taken at atmospheric pressure when the unit was running. I told him that on running unit minimum cold gas temperature was 38 degC and the above Dew Point converted at 3.5 barg Hydrogen Pressure comes to 13.3 degC which is 24.7 degC lower than the Gas Temperature. At that time I had also instructed that in case the unit trips and the cold gas temperature goes below 38 degC the Hydrogen Pressure should be reduced to maintain the Dew Point 20 degC below the cold gas temperature.

If you are dealing with Generators remember that the Dew Point increases with Gas Pressure whether it is air or Hydrogen. The measurement of Dew Point done by Portable Dew Point meter is at atmospheric pressure and you need to convert the measured Dew Point at the Gas Pressure and this online calculator is a handy tool to convert. The converted Dew Point should be atleast 20 degC below the Gas Temperature.

Saturday, November 10, 2012

Accuracy of Condenser Vacuum indication in Control Room

Modern power stations have pressure transmitters and digital display of Condenser Vacuum in the Control Room. Although the measurement is adequate for monitoring on day to day basis for the same unit there is a problem when you compare the Condenser Vacuum of one unit with another identical unit in the power station. Because when you compare the difference in the two values it is small e.g. Unit no 1 showing -89 Kpa and Unit no 2 showing -90 Kpa and you are making a statement that Unit no 2 is having better vacuum than Unit no 1. In addition some people have a fascination for the magic figure of -0.9 or -90 Kpa and hate any value below the figure.

I generally suspect the measurements when dealing with small differences in the parameters and try to cross check with other parameters and very often I have found that Unit showing -90 Kpa is actually worse than the Unit showing -89 Kpa. My favourite parameter is Condensate Temperature at the suction of Condensate Extraction Pump and my memory takes me to good old 210 MW units.

The sizing of the Hotwell was inadequate in old 200/210 MW units and the  Deaerator level control valve could not work at low Condensate Flows. It was almost impossible to maintain Hotwell level unless you raise the level to full and also use part of the Condenser where area of cross section increases many fold and the storage volume increases beyond the capacity of the Hotwell.

When I looked at the Condensate Temperature in such Unit having small Hotwell capacity I suspected under cooling of Condensate and asked the Desk Engineer to reduce the Hotwell level. When the Desk Operator brought the level within Hotwell the Condensate Temperature increased by more than 2 degC. The under cooling of Condensate was happening because the Hotwell level was being maintained in the Condenser submerging some tubes.

By the time NTPC designed the 200 MW units for Singrauli the above problem was well known and the cross section of Hotwell was made much bigger than the original design but again it was same old Hotwell at Vindhyachal 6x210 MW since it came from USSR.

I hope those reading this blog post are having adequately sized Hotwell and are not maintaining the level in Condenser in their power station and in case the Hotwell is small they can always bring down the level to avoid under cooling of Condensate.

When you are sure of that compare the Condensate Temperature of two units as well and your statement that Unit no 2 is having better vacuum than Unit no 1 may be wrong. 

Friday, October 26, 2012

Comparison of Condenser Vacuum in Cooling Tower versus once through Cooling Water System.

I am going to mostly write about condensing, reheat turbines with regenerative cycle. Condenser Vacuum is the vital parameter of such machine and let us talk about what is achievable today compared to old power stations.

Once again my memory takes me to Obra. On local panel we use to have a mercury tube indicating as much as 712 mmHg vacuum in December/January. In summer it use to be around 690 mmHg.

Our competitor was Badarpur where it hardly touched 690 mmHg in winter.

I asked the Engineering Department in BHEL Haridwar and they told me that Badarpur Station had Cooling Tower whereas Obra was having once through Cooling Water System and our Cooling Water temperature was very low compared to what the Cooling Tower would give.

After joining Operation Services Department at NTPC Corporate Centre in 1983 and studying the Acceptance Test Codes of Steam Turbine as well as Cooling Tower I realised the real difference.

The temperature of Cooling Water in once through system can be as low as the Wet Bulb Temperature but the Cooling Tower has to be infinitely large to equal that temperature. We had Induced Draft Cooling Towers designed to deliver 33 degC temperature at 27 degC Wet Bulb Temperature. The difference in the two temperature is called approach. The approach was 6 degC at design point but it was increasing as much as 12 degC at 15 degC wet bulb temperatures.

Without the technical jargon it meant that the max temperature in once through system was 27 degC and in Cooling Tower it was 33 degC. In winter the once through system could be lower than 12 degC but in Cooling Tower it hardly went below 25 degC.

The flagship station of NTPC is Singrauli Super Thermal Power Station (SSTPS) and it has once through Cooling Water system. In modern times there is hardly any station with once through system, therefore, it is my advice that you don't compare the Condenser Vacuum of your station with SSTPS unless you have similar Cooling Water System.

At Jharsuguda we have Natural Draft Cooling Towers. This tower is also built to deliver 33 degC at design point but its performance depends upon both the Dry Bulb and Wet Bulb temperatures. The reason being variation in air flow which is constant in Induced Draft Cooling Towers unless you touch the fan.

In worst weather i.e. both Dry and Wet Bulb Temperatures on higher side the Natural Draft Cooling Tower delivers higher temperature compared to Induced Draft Cooling Tower but in Winter it delivers lower temperature due to increased air flow.

But the most important aspect of Cooling Tower System is fouling in Condenser Tubes unless you religiously maintain residual Chlorine.

As Turbine Maintenance In-charge at NTPC Vindhyachal Super Thermal Power Station (VSTPS) Stage 1 (6x210 MW) I could not maintain the Chlorination because it was 2 Km long underground pipe failing frequently.

This resulted into slime formation in Condenser Tubes which initiates fouling. I introduced tube cleaning with High Pressure Jet Pumps and got very good Condenser Vacuum but it used to deteriorate within three months in the absence of residual chlorine.

At Jharsuguda we have Sodium Hypo-chloride dozing system which is also having underground piping but thanks to the Chemistry Department which maintains residual chlorine by manual dozing if there are leakages in underground pipes.

Update on 27th May 2013
Since I had seen very good Vacuum at Obra and Singrauli I was under the impression that once through Cooling Water Systems provide better Vacuum but after visiting Tuticorin the belief is broken.

I was expecting better measured value of Condenser Vacuum at Tuticorin because at seashore the atmospheric pressure is maximum. What you see in the gauge or indication in Control Room is the difference between the Turbine Back Pressure and atmospheric pressure. Other things being equal i.e. for same absolute back pressure (say 0.09 ata) what you read at Singrauli (for atmospheric pressure of 1.0126 ata) will be -0.9226 Kg/cm2 and at Tuticorin (for atmospheric pressure of 1.033 ata) it should be -0.943 Kg/cm2.

Although I found my familiar mercury in glass Vacuum Gauge at Tuticorin and expected better than 690 mmHg, it was disappointing to see 660 mmHg.

On analysis I found CW Pump assisted Siphon formation in Condensers Water Box and the practice of not running Water Box Priming Ejector periodically to remove liberated dissolved gases.

Wednesday, October 24, 2012

Zero of Axial Shift Indicator.

What I learnt in the year 1977 while boxing up bearings of India's first 200 MW unit at Obra (Unit 11) was as follows:

You move the rotor towards the Generator side and the thrust pads which get tightened are called working pads. If the Millwright Fitter had no brains and scrapped the parting plane of the bearing and made it non perpendicular to vertical plane against which the pads are pressed the two halves of the pads will be in different planes, therefore, you must ensure that bottom half as well as top half pads get tightened.How? Measure the axial float with bottom half pads, press the rotor against working pads, put a dial indicator to fix the axial position of the rotor to zero, assemble the top half pads, measure the axial float again, press the rotor against the working pads and see whether you get the zero in the dial indicator and nearly the same axial float.

The activities in the previous paragraph are supposed to be done before the box up of the turbine casings because the reference point of steam flow path is  when the rotor is pressed against working pads. Since I was not present before box up I re-checked to confirm and to give clearance for final checking and calibration of Axial Shift Indicator which should also indicate zero with rotor pressed against working pads.

My curiosity was what position the rotor takes while the machine is on load. The unit was synchronized on 31st December 1977 and it was fulfilled. The rotor gets pressed towards the working pads and the axial shift indicator indicates negative value corresponding to the thickness of the oil film which also varies. What happens when the unit trips? The rotor moves towards the non working pads (also called surge pads) and indicates higher negative value. While rotating on Turning Gear (also called Barring Gear) sometimes it almost touches the surge pads and indicates a negative value equal to the axial float in the bearing and this is the acid test of the erection work.

My next curiosity was whether the Turbine trips on axial shift. The answer was it may never trip in 30 years life. Then why the axial shift indicator? To indicate:
  • wear of thrust pads if it indicates zero or positive value and
  • axial float in thrust bearing sometimes when on Turning Gear.
After many years I am associated with 600 MW Steam Turbines at Jharsuguda and the same holds good but people who have come from various power stations have doubts.

One person confidently says that my knowledge is obsolete and the steam flow path is adjusted with the rotor kept in the middle of the axial float and the axial shift indicator is set to zero at this position of the rotor. When I ask that person which way the rotor goes when the unit is on load he has no answer. He thinks it is the job of operation to see that. When I tell him that the axial shift indicator is not an important parameter for operation because the Turbine is not going to trip on axial shift for its entire lifetime he says then how does it matter what way he sets the zero.

It matters because if you set the steam flow path and the axial shift indicator zero in the middle of the float the Turbine will come on working pads on load and not operate at the intended position corresponding to steam flow path. In addition the axial shift indicator will not serve the purpose of indicating the wear of working pads accurately.

My only advice to such people is to observe what the axial shift indicates while the machine is on load and on Turning Gear and speak accordingly.